In March, a wild month in the markets, most of the factors we track – across sentiment, digital, and especially factor momentum – outperformed, while simple reversal strategies had their worst intra-month returns in recent history before rebounding massively in the last half of the month. What happened?
Here we dig into the returns of several factors to uncover some of the drivers of the month’s quant performance, and offer a few possible explanations.
Basic Reversal
Below is a simple chart of dollar neutral gross returns of equally weighted portfolios, based on going long and short the extreme deciles of trailing 5-day return reversal, rebalanced daily, in developed markets. This is just about the most basic “stat arb” strategy you can run, and while it’s not a great strategy of course, it does represent a boiled down version of what underpins a lot of mid frequency stat arb reversal.
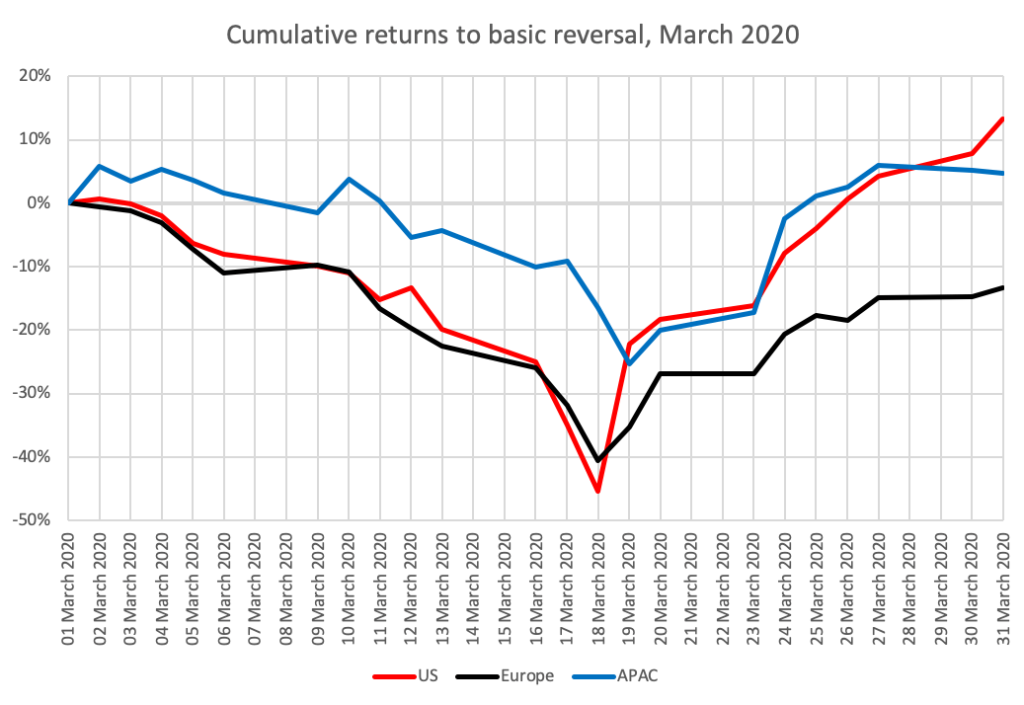
Check out that Y axis. This is just long minus short without additional leverage!
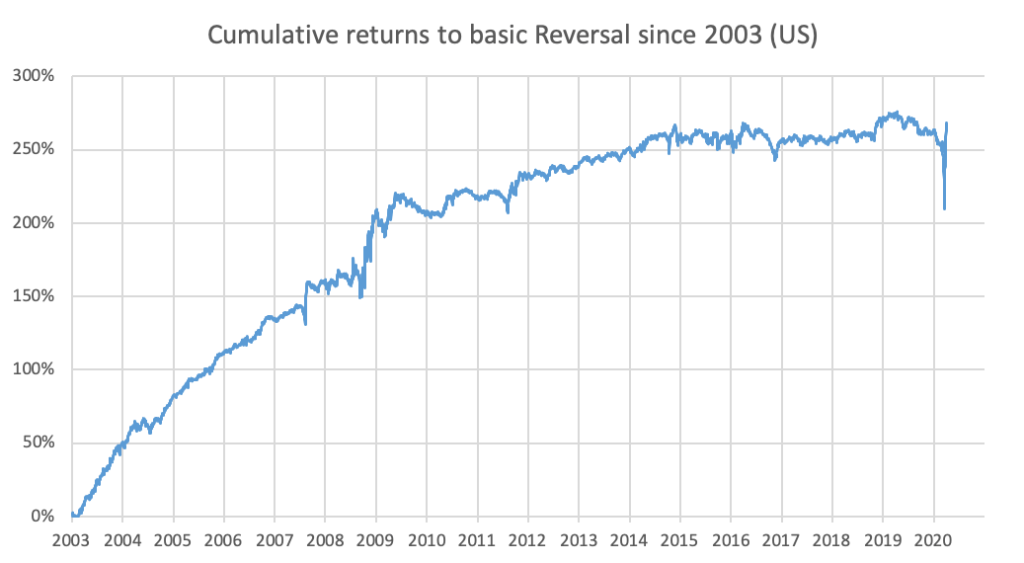
Just to put the magnitude of this drawdown into context, here’s the same chart for the US, going back over time:
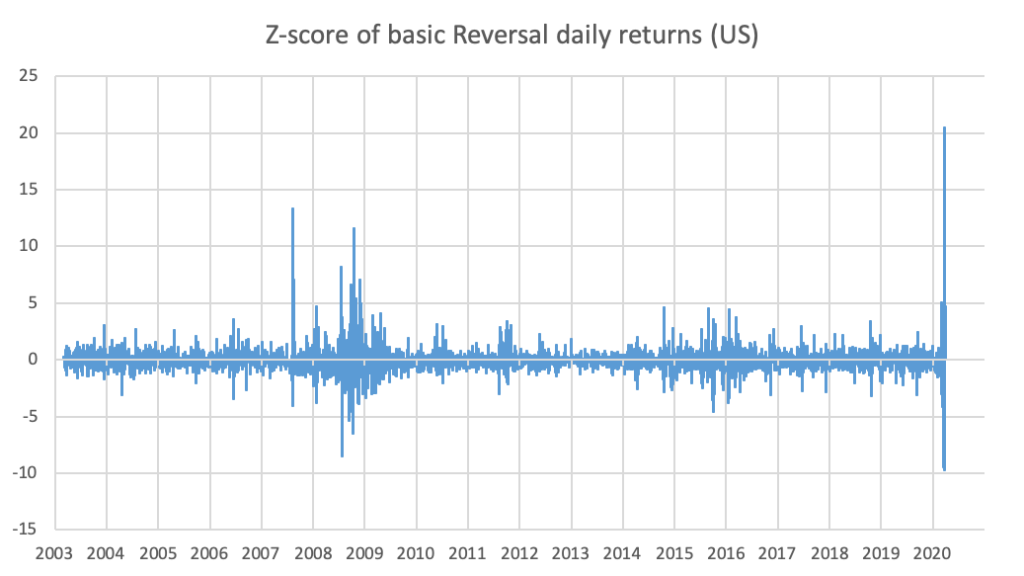
And here are the daily returns’ Z scores, using an expanding window to calculate the average and standard deviation. The 17th and 18th were 10-standard-deviation negative events, and the 19th was a 20-standard-deviation positive event, even after taking into account all previous days’ moves including August 2007, the first 10+ standard deviation event on the graph (you can see my article about the 2007 Quant Crisis here). That’s pretty nuts!
Common Risk Factors
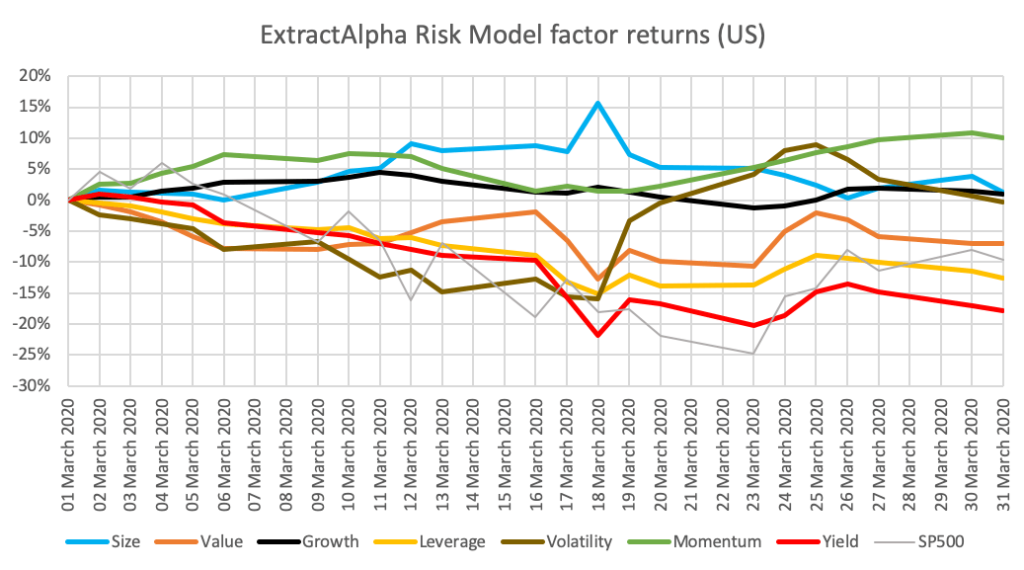
Meanwhile, what was going on with common fundamental factors during last month in the US? Here are the returns to the factors in the ExtractAlpha Risk Model for the US:
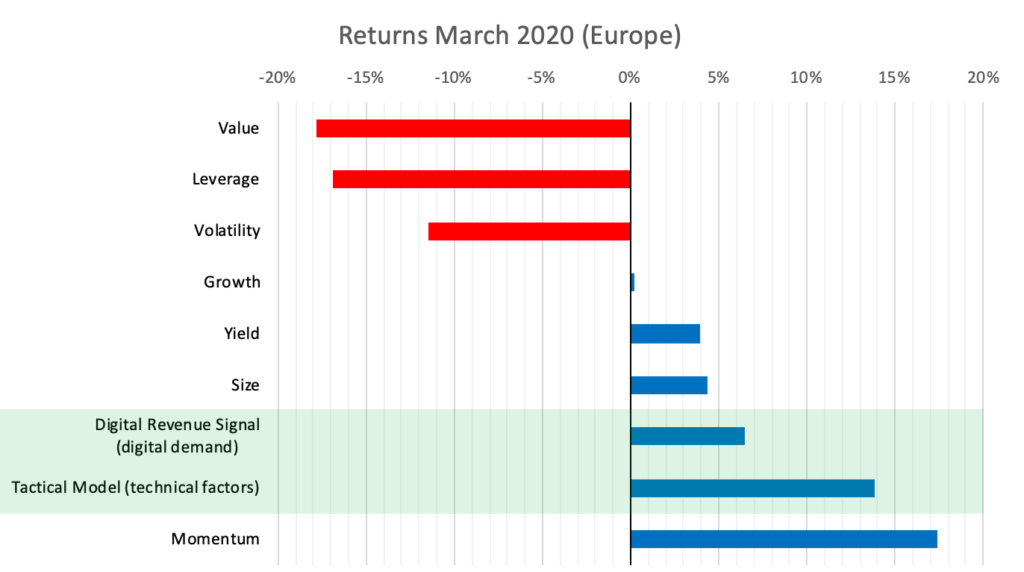
Factor returns in Europe performed similarly: (we also cover Asian markets)
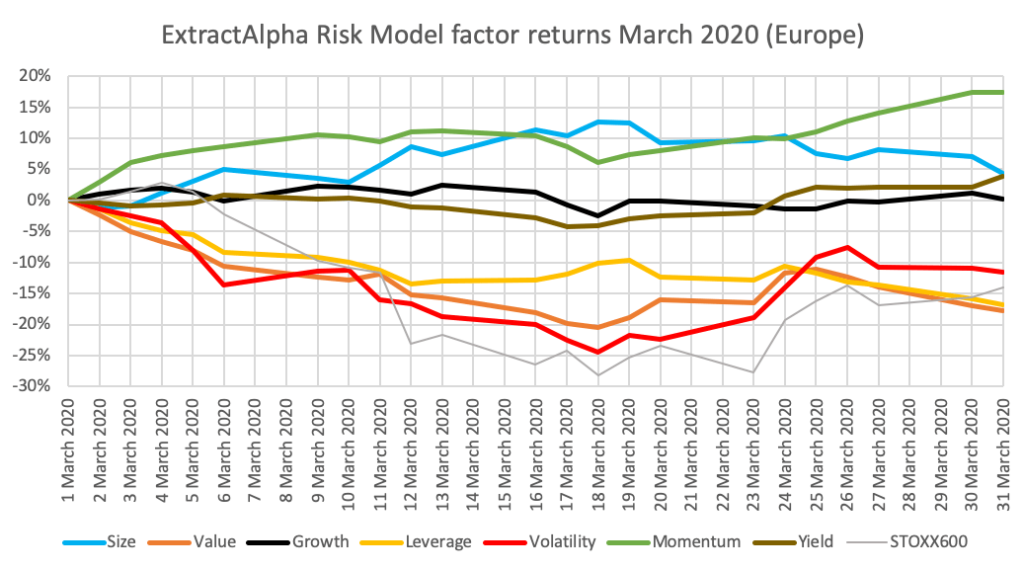
Both U.S. and Europe experienced relatively big moves, with Momentum outperforming strongly and Value-type factors underperforming.
It’s also worth mentioning that the big dislocation in these factors, and the bottom in the Reversal charts, occurred on March 18th, whereas markets didn’t bottom until the 23rd.
Technical Factors (Tactical Model, Factor Momentum, and Residualized Reversal)
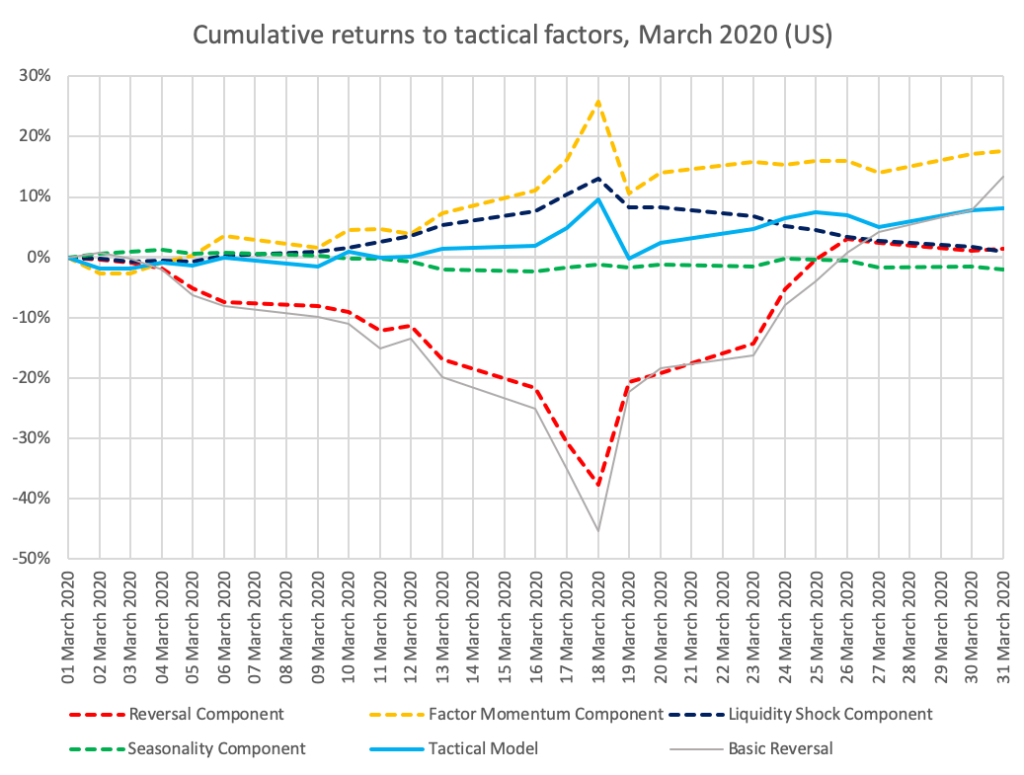
Notably, these factors were all trending, with their daily returns strongly positively autocorrelated. In fact, ExtractAlpha’s Factor Momentum score, which is a component of our Tactical Model – a model focused on technical dynamics – is designed explicitly to capture these factor trends, and as a result it performed very strongly during these trends, albeit with a single-day drawdown on the 19th (immediately after the factor dislocation and reversal drawdown ending on the 18th).
Our Tactical Model also has a Reversal Component to it, which despite being a bit more sophisticated than the basic reversal model – it takes into account risk factor exposures by looking for reversals in returns which have been residualized to our risk factors and industries for example – performed similarly.
Overall however, our Tactical Model experienced far less volatility as a result of the strategy’s diversification; in addition to Reversal and Factor Momentum, our Tactical Model also captures Liquidity Shocks and Seasonality, a total of 4 components.
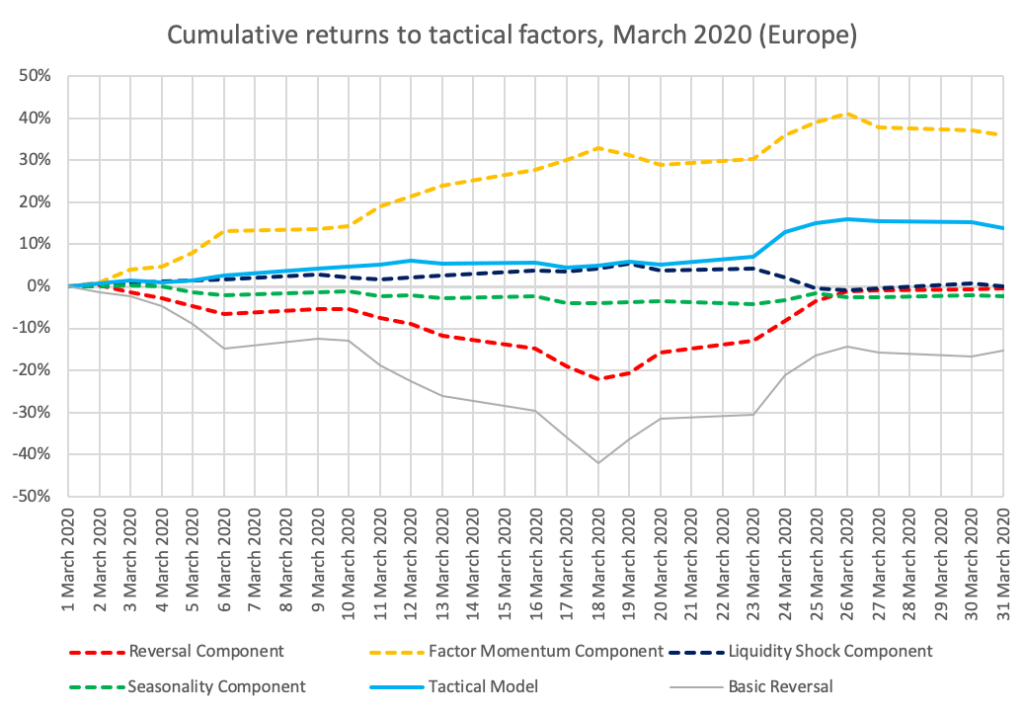
In Europe, monthly performance for the month of March was even stronger, with the Factor Return Component returning 36% and the overall Tactical Model returning 14%!
Our view on what happened
So, factors were trending, and stocks which appeared otherwise similar in risk profile but had divergent returns had their returns drift apart over the first half of March rather than mean-revert as they usually did.
One reasonable explanation is that there’s a latent “COVID-19” risk factor, not included in any conventional risk models, and that this factor – like other common factors – was trending. So the reason those otherwise similar stocks diverged was that they differed in exposure to the COVID-19 factor and that factor itself had a large drawdown followed by a rebound; a reversal strategy conditioned on this factor wouldn’t have made the trades shown in the reversal strategies above. Most likely the majority of quant players hadn’t quantified a COVID-19 factor in time for March, though it’s possible that more statistical methods (such as a quickly-evolving principal components-based statistical model) may have.
A different, but not mutually exclusive, explanation is that the large drawdowns across asset classes and strategies (including stat arb itself) in early March triggered selling in liquid strategies generally, as funds anticipated redemptions and decided to sell and lock in their losses – without knowing which day would be the bottom and whether there would be a quick snap-back. With multiple funds selling off their portfolios, and with those portfolios being correlated (i.e., holding similar stocks) because their strategies are correlated (i.e., trading similar alpha models), there was downward pressure on their longs and upward pressure on their shorts, and a domino effect across portfolios which employed the crowded reversal trade. This explanation is essentially identical to the August 2007 one. However, the big March drawdown and subsequent snap back seem to be at least somewhat more narrow in the sense that other common quant factors (including Momentum and Value – to the extent that hedge fund quants still trade Value after ten years of underperformance) didn’t show the same pattern; in ‘07, most common factors did, to some extent.
Either way, it seems that the first half of the month did have severe effects on some quant funds, generally negatively for stat arb and, anecdotally, positively for some HFT and trend-following CTA strategies. We aren’t basing this on any private information, but on publicly available articles like this about Point72, this one about Schonfeld, this one mentioning OxAm and RenTech in addition, this one about DE Shaw’s stat arb fund, and some contacts’ responses to my LinkedIn post from the middle of the event here mentioning Ronin Capital and others.
Performance from our alternative data models
Meanwhile, how about the alternative data factors we track in our other models? They were generally very strong across both U.S. and Europe. These include Cross Asset Model (options market sentiment), Digital Revenue Signal (digital demand), and TRESS (blogger sentiment), in addition to Tactical Model and risk factors in ExtractAlpha Risk Model previously mentioned.
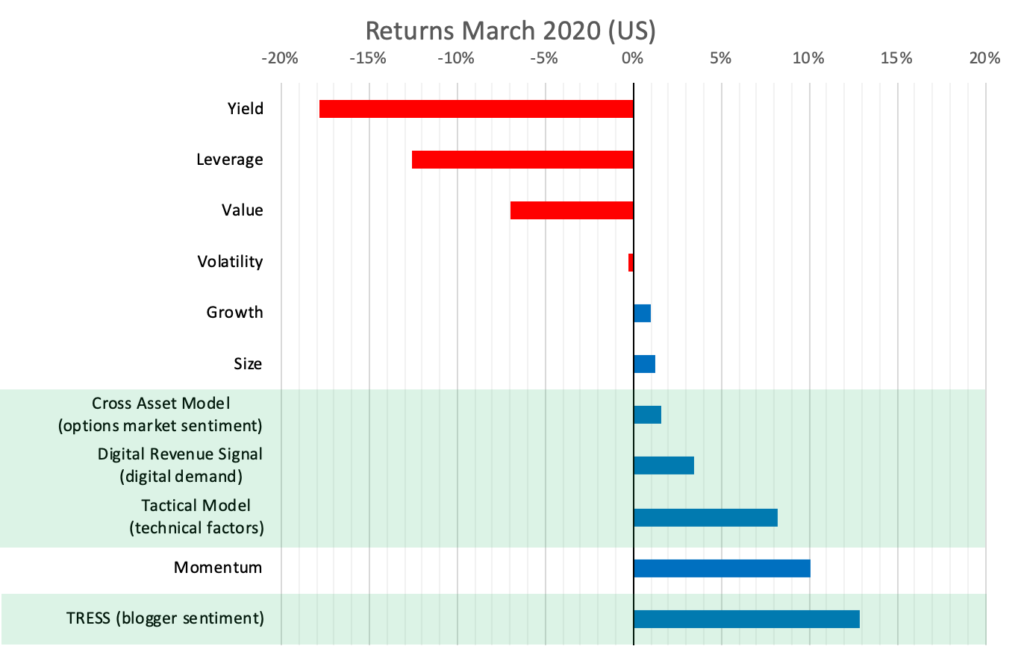
These factors – based on very different concepts and data sources – were all unaffected by the stat arb liquidations, because they aren’t crowded; as we’ve been urging quants since our founding in 2013, especially in light of the August 2007 event, quants need to diversify their alpha sources. That seems even more obvious now, but it is surprising that even in 2020 quants continue to be exposed to crowded, price-based trades when there are now quite a few proven, diversifying alternative data-based quant factors available in the market.
When the dust settles from the recent market turbulence, we expect that these unique alpha sources will attract a lot of attention.