The Tactical Model (TM1) is a global stock selection and position timing model developed by ExtractAlpha. TM1 improves upon simple price reversal strategies in several ways:
- By intelligently controlling for risk factors
- By conditioning reversals on volume effects
- By taking into account uncorrelated mid-horizon alpha strategies, including factor trends, liquidity trends, and seasonality, in 3 separate components
In this research note we examine the performance of these technical factors alongside simple price reversal, with a particular focus on the large outperformance of factor momentum during the first half 2020, during which high-scoring Factor Momentum stocks have outperformed low-scoring stocks by 67% through mid-June.
We measure a signal’s ability to forecast returns by tracking the gross (pre-transaction cost) cumulative return (not compounded) to a portfolio which goes long the top decile of U.S. stocks and short the bottom decile of U.S. stocks each day according to that strategy, with daily rebalancing and equal weighting, subject to a minimum market cap of US$100m, minimum ADV of US$1m, and minimum price of US$4. Using this methodology, we look at the Tactical Model and each of its four subcomponents, alongside Basic Reversal – which is just the 5-day cumulative return of each stock, with the sign inverted.
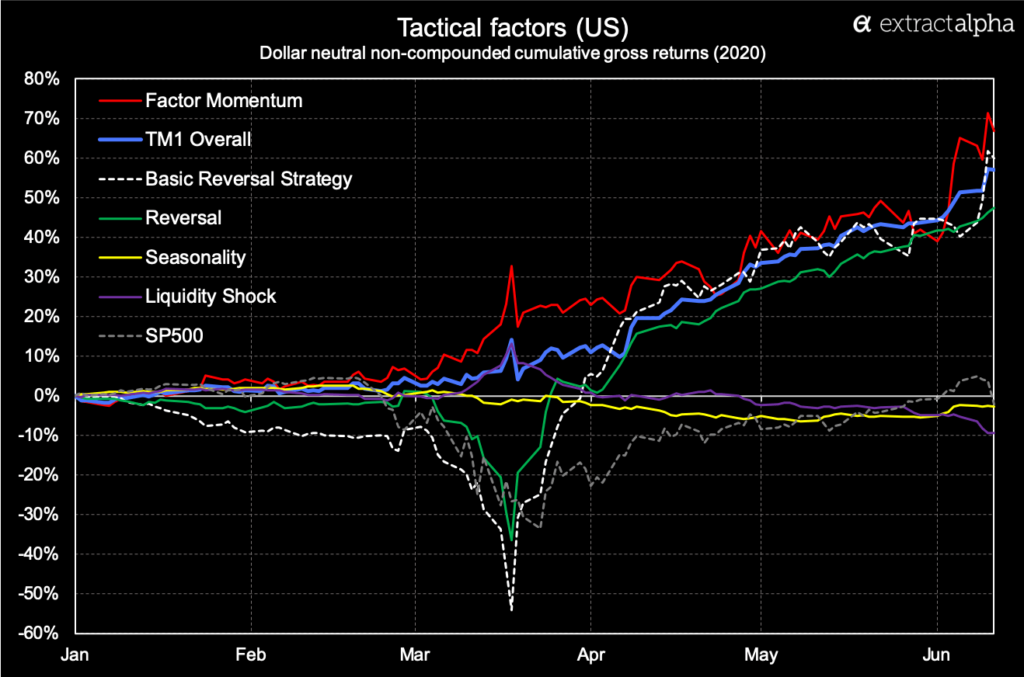
Here we see a large reversal drawdown in mid-March as news of the coronavirus spread, which we discussed at some length in a March 2020 research note, followed by a strong rebound. The Tactical Model’s smarter variant of Reversal, being less crowded and more sophisticated than basic reversal, experienced less of a drawdown and a similar bounceback.
The Liquidity shock and Seasonality components have not done much that’s interesting this year to date. Factor Momentum, however, has been very interesting, and a very valuable diversifier for reversal strategies. The basic idea behind Factor Momentum is as follows:
- If we decompose a stock’s return into an idiosyncratic portion and a portion which is explained by common risk factors, then the idiosyncratic portion of that return will usually reverse.
- These stock-specific moves may be largely liquidity driven rather than informational or fundamental, and as such may be temporary.
- This is why in our Reversal Component we use residual returns rather than total returns, with these residual returns having the effects of the common factors removed.
- We further refine our identification of these idiosyncratic moves as liquidity-driven by focusing on large idiosyncratic return moves which are accompanied by relatively light volume.
- The common factor component of returns, however, tends to trend over short horizons of about one day in the U.S. (and a bit longer in other markets).
- When large institutions move money into a particular style, they tend to do so over multiple days, so if we identify a factor move on day 1, we are likely to see it again in day 2.
- This is the concept we capture in the Factor Momentum component of the Tactical Model, which scores each stock according to the moves in factors it is exposed to, using the ExtractAlpha Risk Model to measure those moves and exposures.
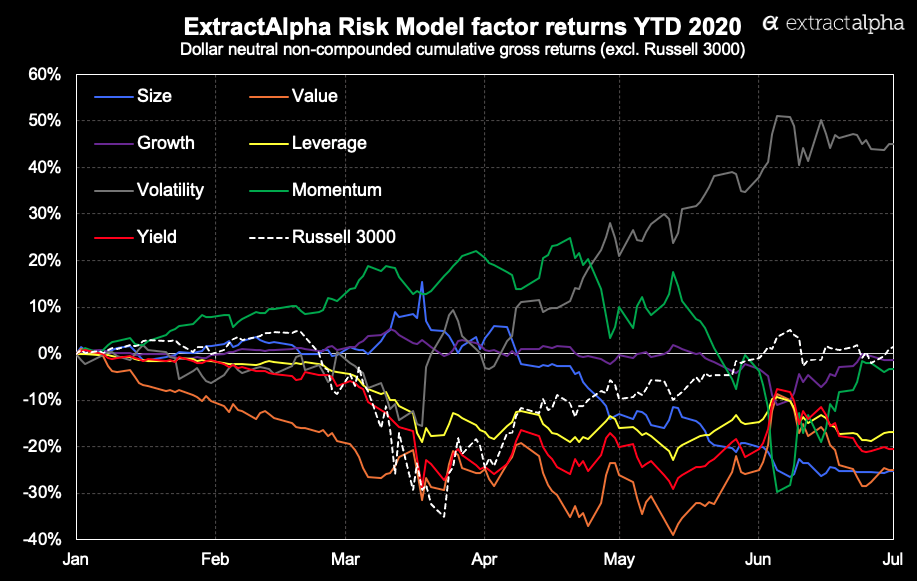
In 2020, we have seen some very dramatic factor moves, and ones which persisted across time. The Factor Momentum component was well positioned to capture these moves and has resulted in significant outperformance of the Tactical Model on a risk-adjusted basis year to date.
We can measure factor moves in two ways: by plotting long-short decile returns, just as we do with the TM1 cumulative return charts above; or by looking at the Factor Returns which are derived from a cross-sectional regression in our Risk Model, which tells us the degree to which each factor explains the cross-section of returns, after controlling for the other factors. It is this latter formulation which we use in our Factor Momentum component, but the former one tells the story of this year to date’s factor moves more clearly and is shown below.

By plotting day-over-day autocorrelations of the factors individually this year, smoothed out to a trailing 252 trading day number, we can see that the average autocorrelation was fairly high at 0.1 going into March. All factors except Size increased in autocorrelation after that point, indicating an increasingly factor-driven market. Size is an interesting exception, and its low autocorrelation is the result of some rapid oscillations in size returns in mid-March, with large and small stocks outperforming by turns.
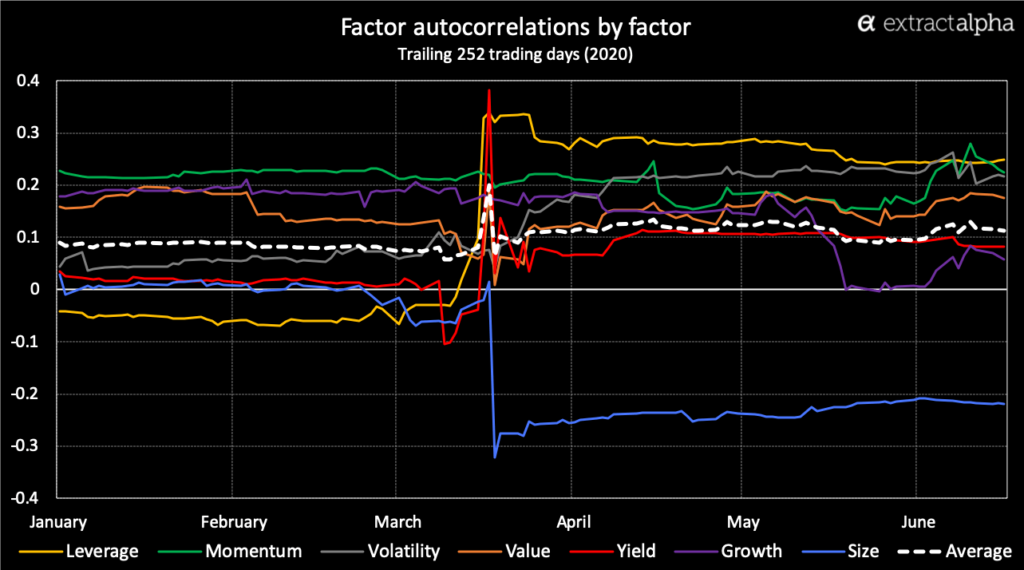
In fact, by some measures we’ve hit a 20-year high in factor autocorrelations recently. Below we plot the factor autocorrelations in two ways: time series, in which we take the trailing one-year autocorrelation for each factor and then average across the factors, and cross sectional, where we do a cross-sectional correlation of the relative performance of the factors each day and then average it out over the last year. Notably, time series autocorrelation hit an all-time high on March 18.
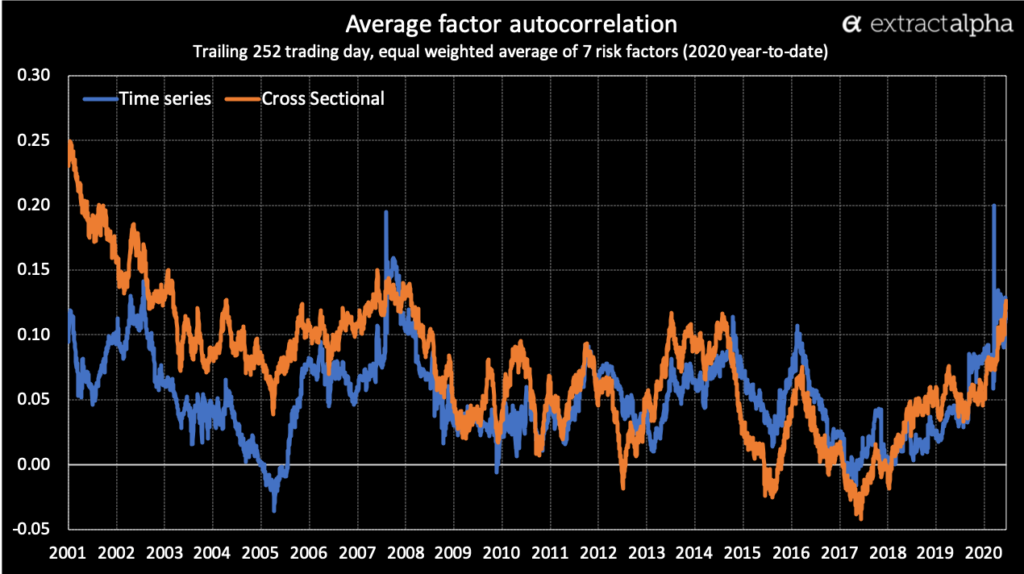
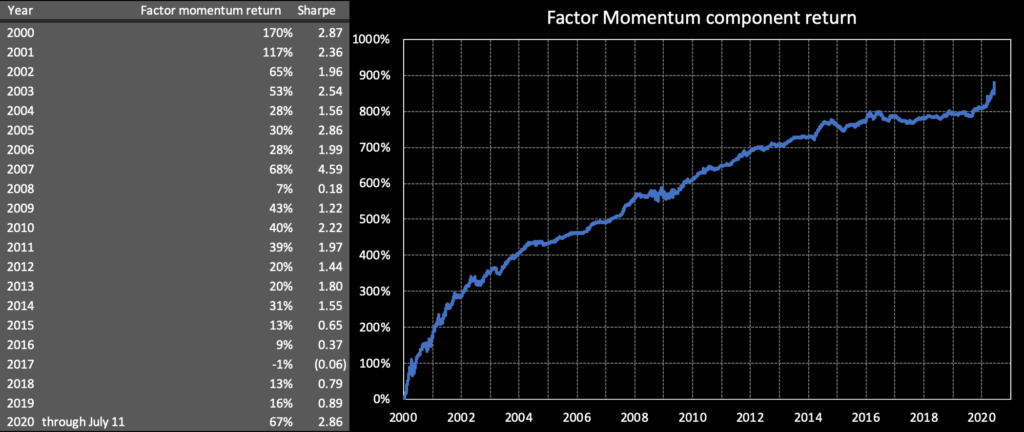
All of this implies that in these market conditions Factor Momentum should perform especially well, and indeed looking at the long-horizon performance of the component, we do see returns which reflect the autocorrelation chart above:
