Companies with strong and improving digital footprints, who engage their customers online, beat their rivals; that’s what the overwhelming evidence from the Digital Revenue Signal (DRS) has continued to show despite volatility across markets and strategies due to the coronavirus (see research notes from 2020 March and May) and fears of inflation.
DRS measures digital footprints at the brand and stock level using Web Traffic, Social Media, and Search Engine data, to predict the likely direction of revenue surprises and revenue growth. Companies with increases in attention are likely to experience increases in demand for their products and services, and therefore are likely to exceed the market’s expectations for revenues when they are announced.
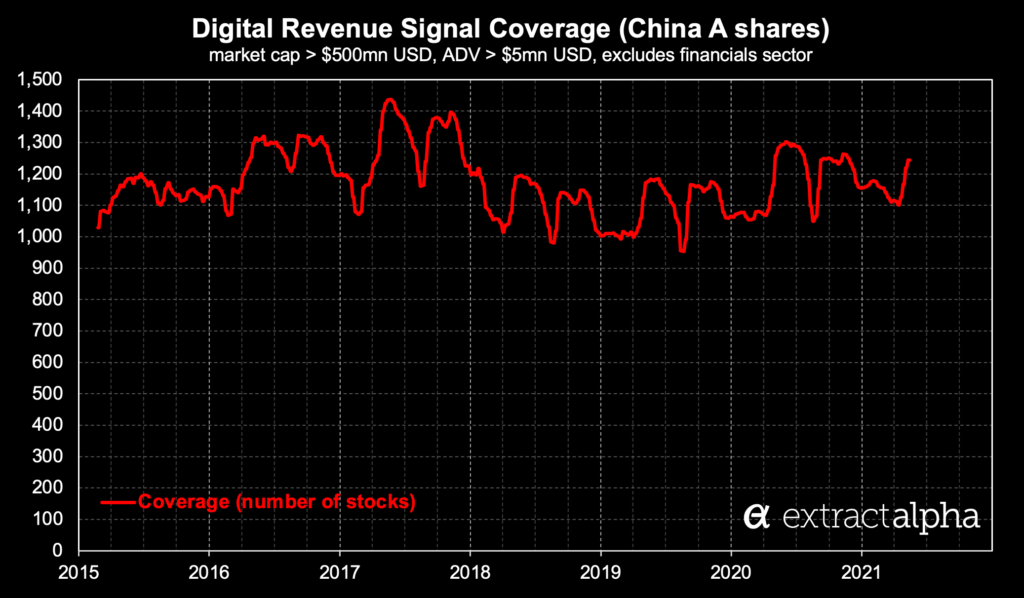
DRS currently covers 8,500+ stocks worldwide, including 1100+ China A shares and 500 HK stocks (includes H shares) since 20150223.

Delivery: daily data feed as csv before market open, 1-100 percentile score for likelihood of beating revenue estimates (with 4 subcomponents)
History: live since 20190901, in sample from 20150223
Contact us for free trial access to complete historical data
Predicting fundamentals (likelihood and size of revenue surprises)
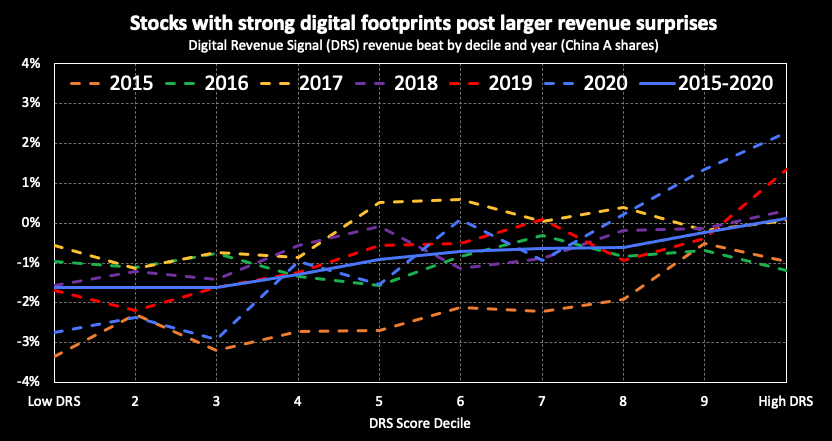
Using DRS each quarter, we track the percentage of companies that beat and miss their revenue estimates based on trends in online consumer engagement. We find that recent results were in line with both historical levels and with every year since DRS went live in 2019; low-ranked stocks miss and most high-ranked stocks beat their sell-side consensus revenue estimates, indicating that markets do not take into account this timely digital data which our clients have access to:

Returns from a simple DRS portfolio
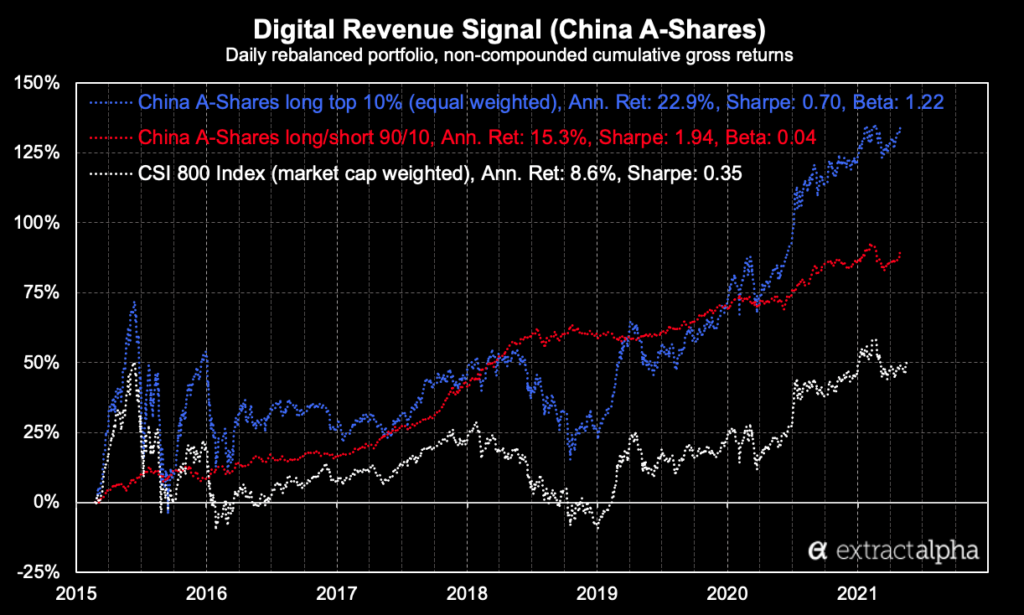
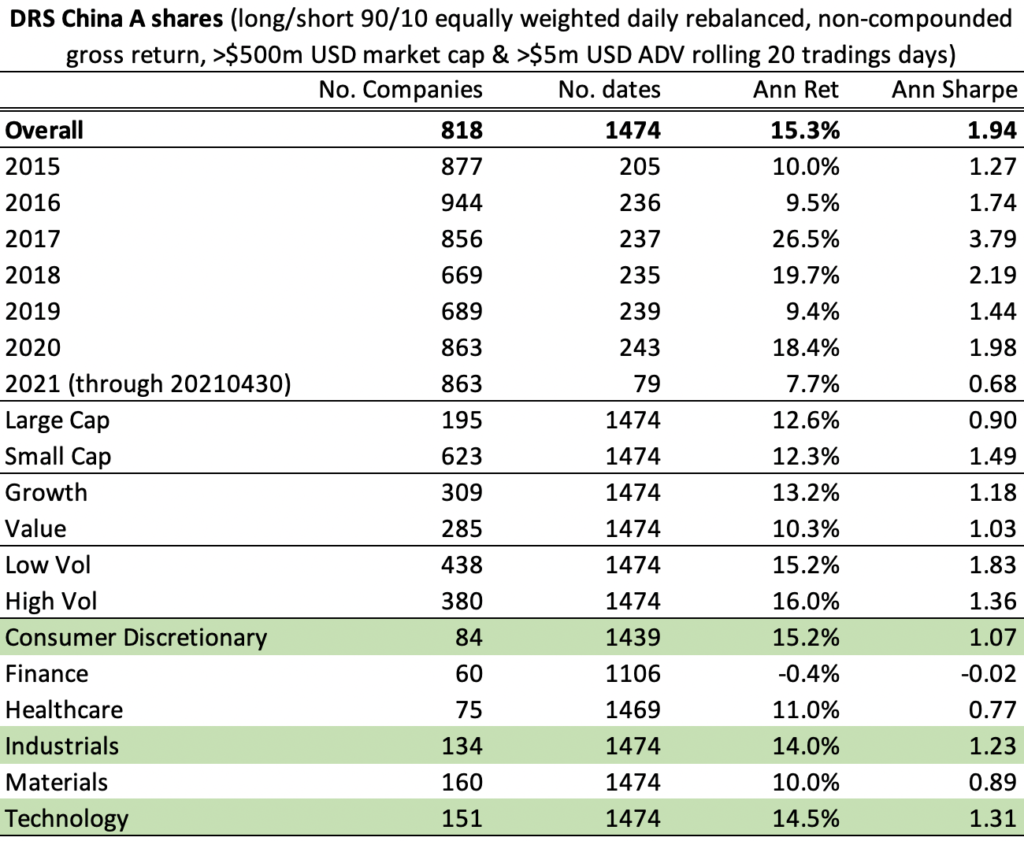
To demonstrate DRS as an alpha factor, our simple portfolio formed by going long the top-ranked decile of stocks and short the bottom decile (dollar neutral with no net exposure, daily rebalanced) delivered a robust +15.3% annualized non-compounded return and a Sharpe ratio of 1.94 before transaction costs (DRS would easily overcome transaction costs given the signal’s low turnover). A long-only top decile portfolio (100-130 stocks on average) delivered +22.9% annualized return and a Sharpe ratio of 0.70, a significant outperformance of more than double compared to its benchmark (CSI 800 index).

Simple cumulative returns, not compounded.
China A shares with market cap >= $500mm, ADV >= $5mm, excluding financial sector.
Equally weighted, rebalanced daily
